Photometric Redshifts
In order to understand the growth of cosmic structure and the nature of dark energy, astronomers today need to study the simultaneous evolution of hundreds of millions of galaxies over cosmic time. In order to do this, we must trace not only their positions on the sky but also their physical distances from us to extraordinarily high precision. Obtaining these measurements requires knowing each galaxy’s redshift (z), a measure of how much its light has been stretched over time due to the previous expansion of the universe. Redshifts are most often derived using spectroscopy, which monitors the continuous intensity of light as a function of wavelength, in order to search for specific atomic emission lines whose observed wavelengths can be compared to equivalent measurements on Earth.
While spectroscopic redshifts (spec-z’s) are extremely precise, obtaining good spectra is expensive and time-consuming. Instead, wide-field surveys such as HSC choose to rely on photometry, which measures the average intensity in a variety of different broad color filters, to obtain data on billions of galaxies. As a result, astronomers rely on “photometric redshifts†(photo-z’s) derived from these multi-color imaging data in order to conduct studies using large populations of galaxies. To better understand dark matter, dark energy, and the growth of cosmic structure of our universe that remains entirely mysterious to us, HSC requires good photo-z’s for a large number of galaxies in a contiguous redshift range. However, to enable future missions to probe the farthest reaches of our universe, HSC will also rely on accurate photo-z’s to very rare, high-redshift objects. Deriving quick and accurate photo-z’s to HSC’s enormous sample of galaxies is thus a crucial part of enabling HSC-driven science.
Methods
There are three main approaches for deriving photo-z’s. Template fitting approaches rely on comparing a set of galaxy models and their redshift-evolution to the observed data. Machine learning approaches use simple algorithms that model the complex relationship between color and redshift in existing “training” data. Spatial clustering approaches take advantage of correlations between large-scale spatial structure between previous observations and compare them those seen in new data. HSC will rely on all three methods to ensure high quality photo-z’s are available to science users.
Currently, the following four methods are available. These are complementary to each other.
- DEmP (machine-learning based on polynomial fitting)
DEmP is an empirical method to measure the photo-z. A polynomial function to express the redshift as a function of magnitude is derived by using training set that have true redshifts. Training set is divided into small segments in a fifteen dimensional space (five magnitudes and ten colors) to find the best polynomial functions. Bootstrap and Monte-Carlo methods are used to generate a number of realizations and then to obtain the probability distribution function (PDF) for every single object. More details can be found in Hsieh & Yee (2014), ApJ, 792, 102
- LePhare (template fitting with COSMOS prior)
LePhare is a code to obtain the photo-z by traditional template fitting method. Single Population Synthesis (SPS) models are used and the theoretical spectra are calibrated using spectroscopic samples. Once we got a pdf of each galaxy, prior to redshift distribution constructed from the 30-band photo-z of COSMOS is multiplied to have a posterior distribution. More details can be found in Ilbert et al. (2009) ApJ 690, 1236 and Coupon et al. (2015) MNRAS, 449, 1352
- MIZUKI (template fitting with Bayesian priors)
MIZUKI gives the photo-z and related physical quantities like star formation rate, stellar mass and the amount of dust extinction. It is based on the traditional template fitting with applying prior probabilities to the physical parameters. Introducing the prior functions enables us to fit the SED models in a realistic range of the physical properties of galaxies. Photo-z’s for QSO is also available. More details can be found in Tanaka (2015) ApJ, 801, 20
- MLZ (machine-learning based on random forest)
MLZ is a publicly available photo-z code to compute photo-z based on the machine learning. The random forest (TPZ) and self organized map (SOMz) are implemented in this code and we have used the random forest. The training set is divided in the nine phase space (five magnitudes and four colors) with subsequent binary partition tree until the number of subsample satisfies the termination condition. Repeating this with randomized training set constructed both from bootstrap and Mote-Carlo methods to have probability distribution functions. More details can be found in Carrasco Kind & Brunner (2013) MNRAS, 432, 1483 .
In addition to those catalogs, we plan to develop the following independent methods to have better performance of photo-z and to maximize the value of the photo-z catalog to the various science cases.
- Clustering photo-z
A spacial correlation of the galaxies provides us with an independent information about the radial distance to the galaxies. The photometric galaxies which has no redshift can be cross-correlated with the spectroscopic samples. Recalling that the galaxies at different redshift has negligible correlation, and if we chose the spec-z sample within a narrow redshift range, we can estimate what fraction of the photometric sample is laying inside that redshift bin. Repeating this over all spec-z redshift bins will yield redshift distribution of the photometric sample. Given a tons of data, we could divide the photometric sample into either small patches in color space, or SOM segments. Applying the clustering method to this small subsample enables us to obtain the photometric redshift for each object, in addition to the overall redshift distribution. Newman (2008) ApJ 684, 88 , Menard et. al (2013) arXiv:1303.4722 , Rahman et. al (2015) MNRAS 447. 3500
- Hybrid method based on SOM
Machine Learning using Stratified Bootstrap Monte Carlo (MLZ-SBMC) is a new photo-z code that combines publicly available methods in scikit-learn with Self-Organizing Maps (SOMs). In brief, first the input data is projected onto a SOM constructed using full color information and uncertainties, after which the every “cell” on the SOM is assigned a particular “relevance weight” based on the relative distribution of the training/test objects across the SOM. An ensemble of individual “learners” is then constructed from numerous Monte Carlo realizations of stratified re-sampling across the SOM with thresholds to highlight rare but informative objects during training. Finally, predictions from each individual learners are combined using kernel density estimation to generate full, smoothed PDFs for each object. Individual learners can take advantage of both traditional methods such as generalized linear models, k-nearest neighbors, and decision trees, as well as new hybrid approaches that combine decision trees with template fitting approaches and SOMs with Gaussian Processes. More details can be found in Speagle et al. (2016, in preparation).
HSC photometric data
HSC survey observes sky with five broad bands, g, r, i, z, y and four narrow band filters, NB387, NB816, NB921, NB101 where the filter names represent the central wavelengths. Filter function and quantum efficiency of the CCD and other transmission curves can be found at http://subarutelescope.org/Observing/Instruments/HSC/sensitivity.html. The target depths for each band is summarized in the survey page. Currently we use only broad bands to measure the photo-z. Fluxes are measured with HSC-Pipeline in C_model magnitude that provides better total fluxes than Kron or aperture magnitude systems.
Overlapping Spectroscopic Samples
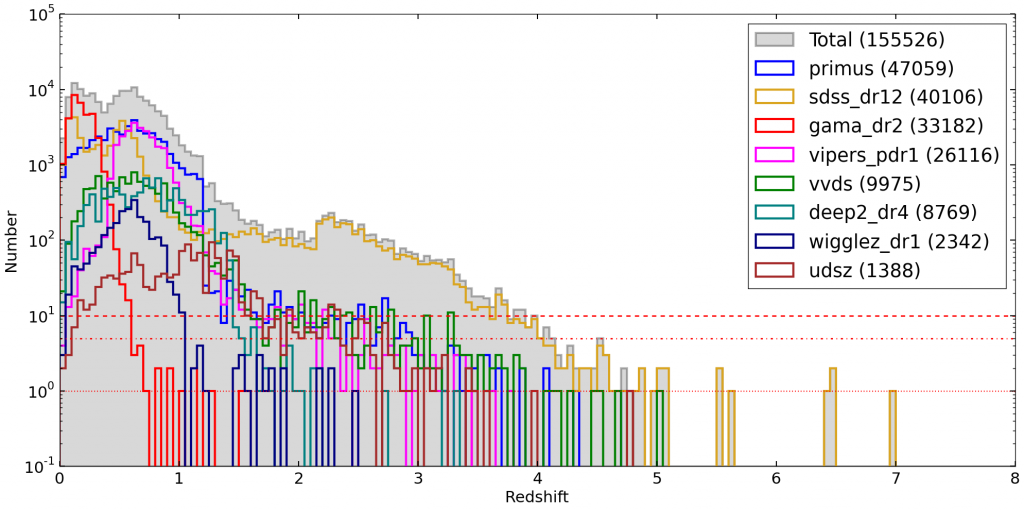
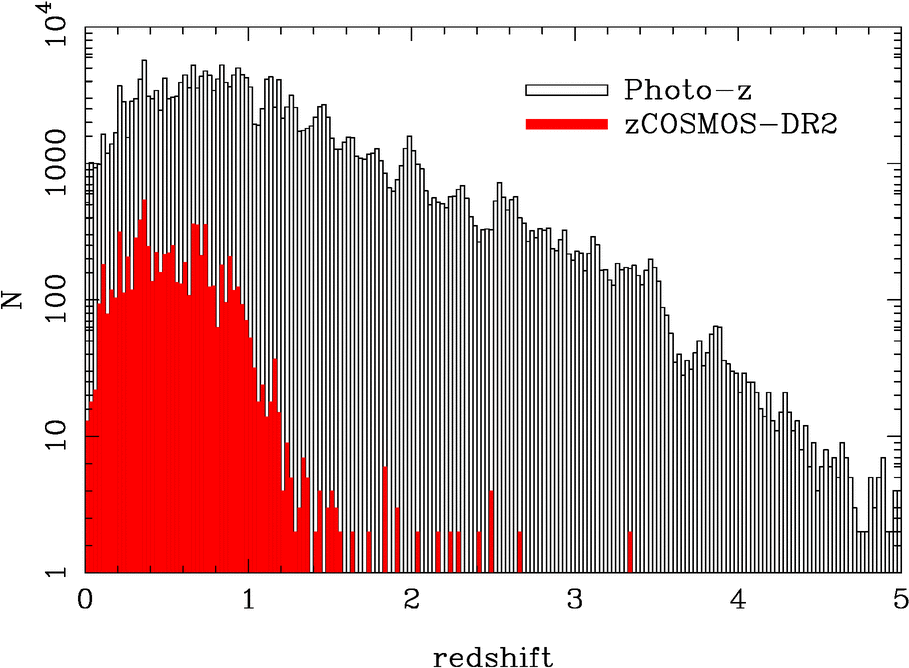
The HSC survey region overlaps with a variety of public spectroscopic surveys. In addition, HSC also covers the Cosmological Origins Survey (COSMOS) field, which contains high quality photo-z’s derived using 30+ bands of photometry from the UV to the IR. All of these samples are used to both calibrate and test the accuracy of our photo-z methods. The distribution of spec-z’s from all overlapping surveys and specifically the COSMOS field is shown below.
| survey | sky coverage [deg2 ] | galaxy number | depth | redshift | RA |
|---|---|---|---|---|---|
| VVDS Wide | 12 | 35,000 | I<22.5 | 0.3-0.9 | 02h30m, 10h, 14h, 22h30m |
| VVDS Deep | 0.61 | 5,000 | I<24.0 | 0.0-4.0 | 02h30m |
| VVDS U-Deep | 0.14 | 500 | I<24.8 | 0.0-4.0 | 02h30m |
| PRIMUS | 9.1 | 120,000 | I<23 | 0.2-0.9 | 02h20m, 10h, 14h, 00h36m, 02h30m, 23h30m |
| zCOSMOS (bright) | 1.7 | 12,000 | I<22.5 | 0.2-1.0 | 10h00m |
| GAMA | 250 | 280,000 | r<19.4 | 0.1-0.3 | 09h, 12h, 15h |
| SDSS (main) | 8,000 | 800,000 | r<17.8 | 0.0-0.3 | |
| AEGIS | 0.5 | 16,600 | R<24.1 | 0.0-1.4 | 14h20m |
| SDSS (LRG) | 8,000 | 90,000 | r<19.5 | 0.2-0.45 | |
| SDSS (QSO) | 8,000 | 110,000 | i<20 | 0.4-2.2 | |
| BOSS (LRG) | 10,000 | 1,500,000 | I<20 | 0.45-0.65 | |
| BOSS (QSO) | 10,000 | 160,000 | g<22 | 2.1-2.7 | |
| HectMAP1 | 50 | 60,000 | R<20.5 | 0.2-0.5 | 13h-17h |
| HectMAP2 | 33 | 60,000 | R<24.1 | 0.3-0.8 | 13h-17h |
| DEEP2 | 2.8 | 38,000 | R<24.1 | 0.3-1.0 | 02h30m, 14h20m, 16h50m, 23h30m |
| WiggleZ | 1,000 | 240,000 | 20<r<22.5 | 0.3-0.8 | |
| zCOSMOS (faint) | |||||
| VIPPERS | 24 | 100,000 | I<22.5 | 0.5-0.9 | 02h, 22h |
Current Status
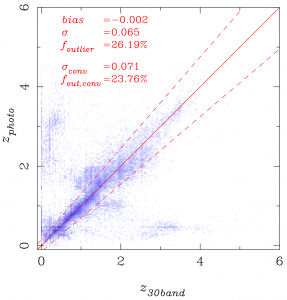
As an example, photo-z performance for S14A_0b DR computed by MIZUKI is shown. Other photo-z catalogs are also available once the data becomes public. In addition to the each photo-z catalog, we plan to conduct a master photo-z catalog which consists of the best performed photo-z at each small patch in color space. Five broad band photometries in COSMOS region at roughly equal to the goal depths of HSC wide layer could achieve quite small bias and a few percent scatters. Outlier fraction is roughly 20-30%, depending on the codes.


