Survey Status (as of Nov 2015)
HSC Wide
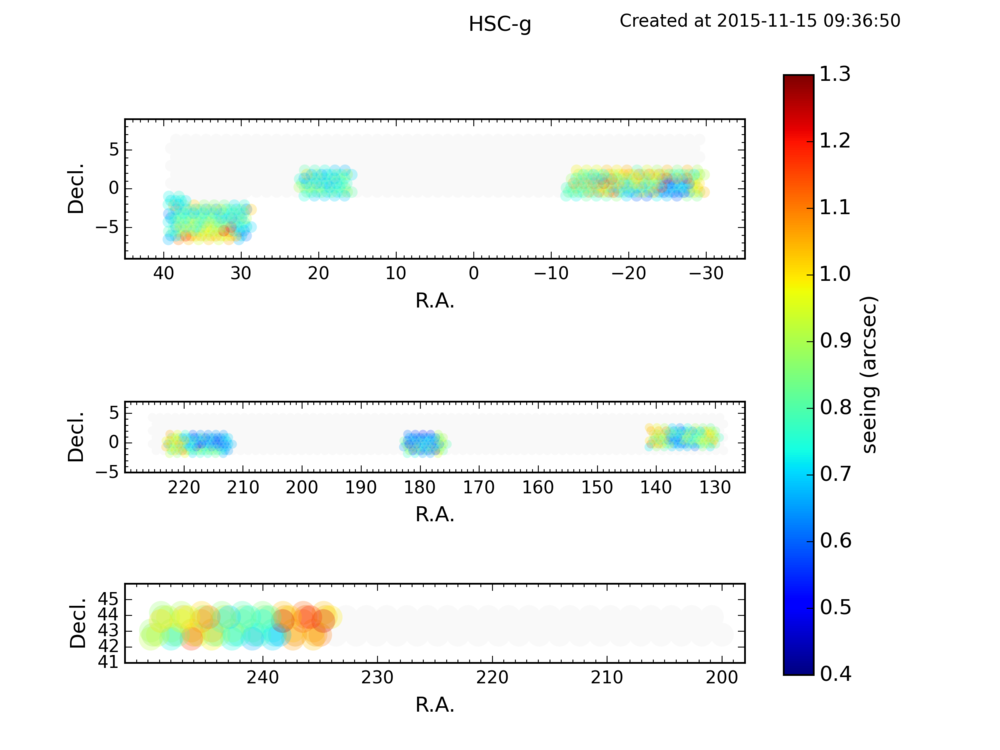
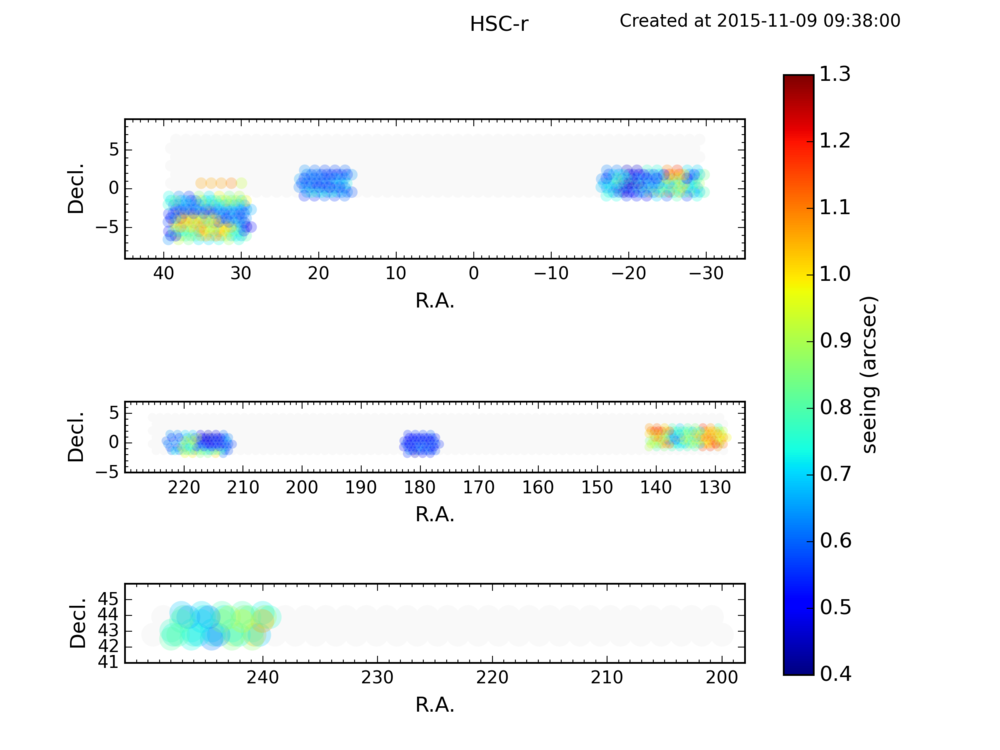
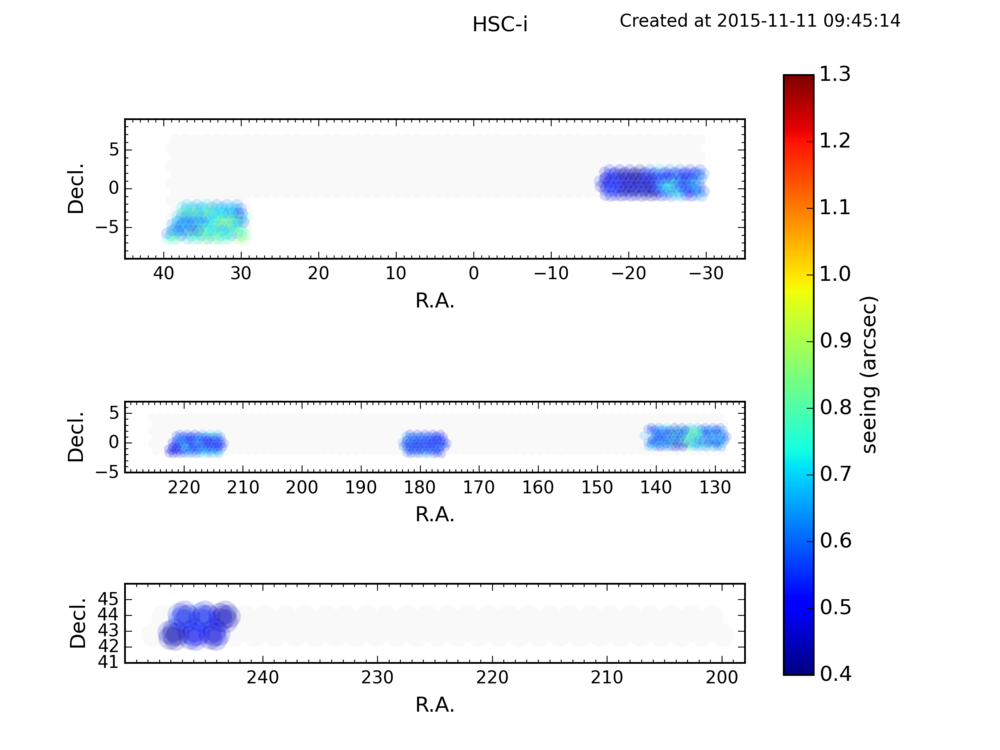
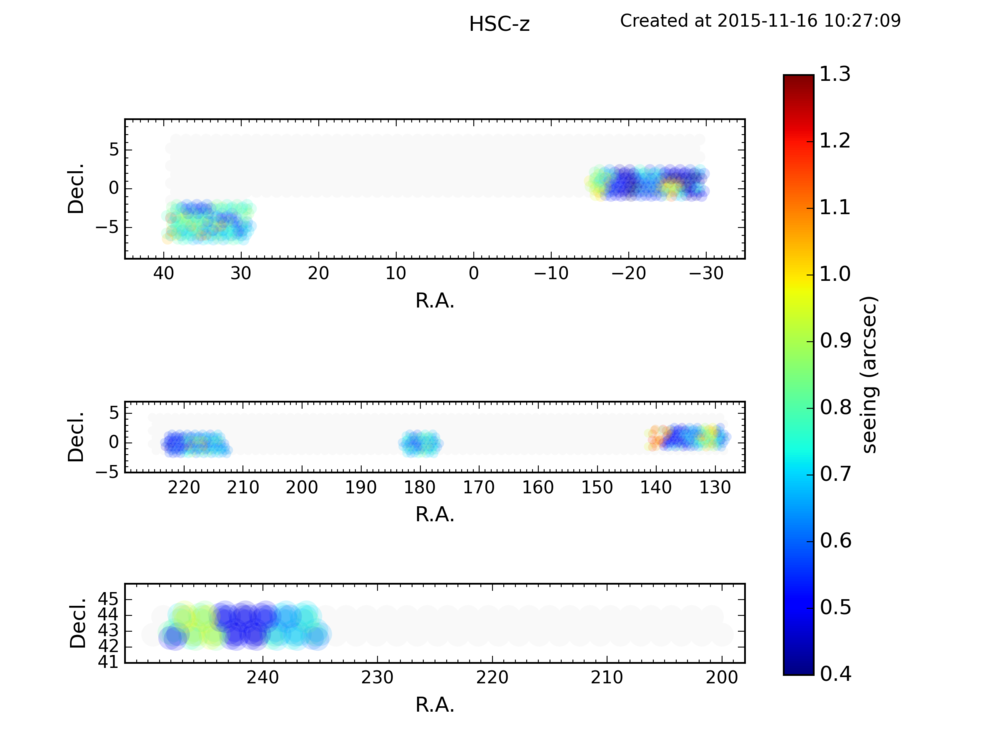
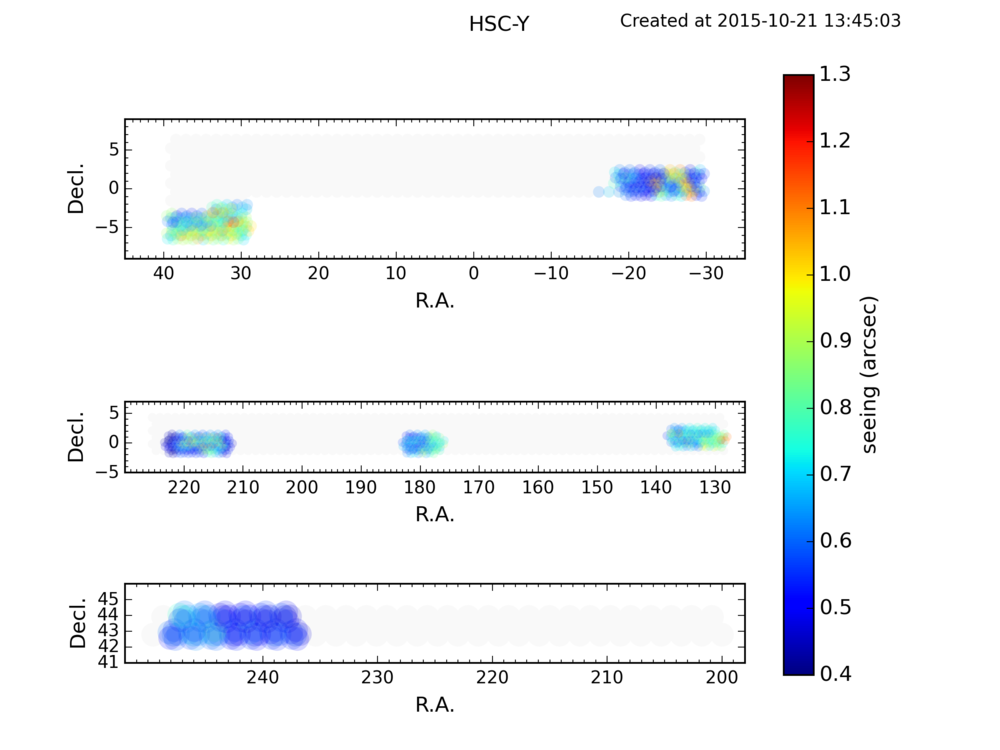
The figures show the area covered in the Wide survey color coded by the seeing. Note the excellent image quality in the i-band; the median seeing is better than 0.6 arcsec!
HSC Deep and Ultra-Deep
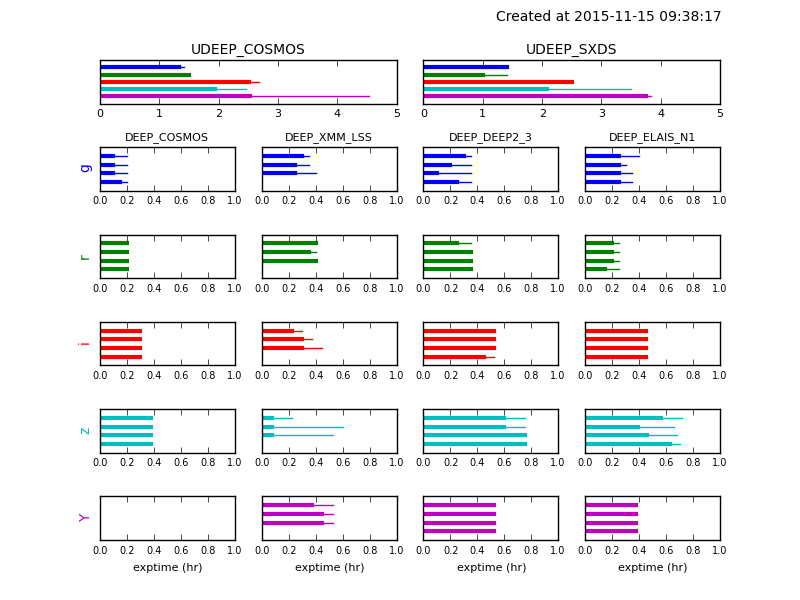
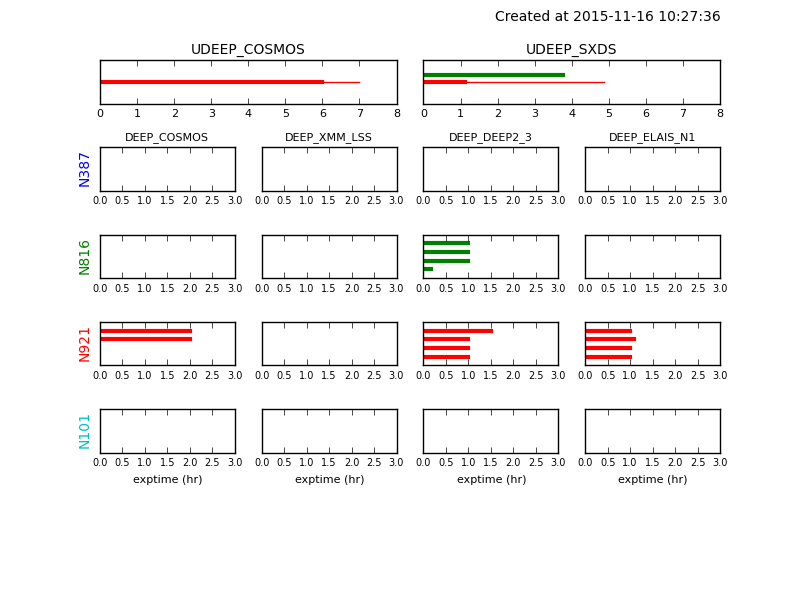
The figures show the exposure time in unit of hour for each filter in each field. The thin lines indicate data with poor quality.
MTa will update all the figures before the site goes public.

